Data Literacy: The Everyday Skill That Changes How You See the World
Introduction
We’re never away from numbers and charts. They are also seen on screens on the phone, news reports, school reports, and price tags when shopping. But many will look at them and not really know what they are.
Data literacy is all about reading those numbers, asking the right questions about them and using the answers to your daily life. It’s not a matter of being a statistician. It’s about being comfortable with receiving information all around you. After acquiring this skill, selections are less confusing and clearer.
What Data Literacy Really Looks Like
Data literacy is being able to interpret or make sense of data. You notice patterns. You see through when something seems amiss. It is up to you to determine if the numbers back up a claim or if there are numbers missing.
Now imagine you are in the food section of your supermarket. One pack claims to be 30% less sugary. Here’s another with a small graph on calories. With Data Literacy, you can make comparisons without getting lost. You measure your portion sizes. You ask the question that is, what is it you are comparing less sugar with? When you leave, you have a better choice.
The Three Simple Parts
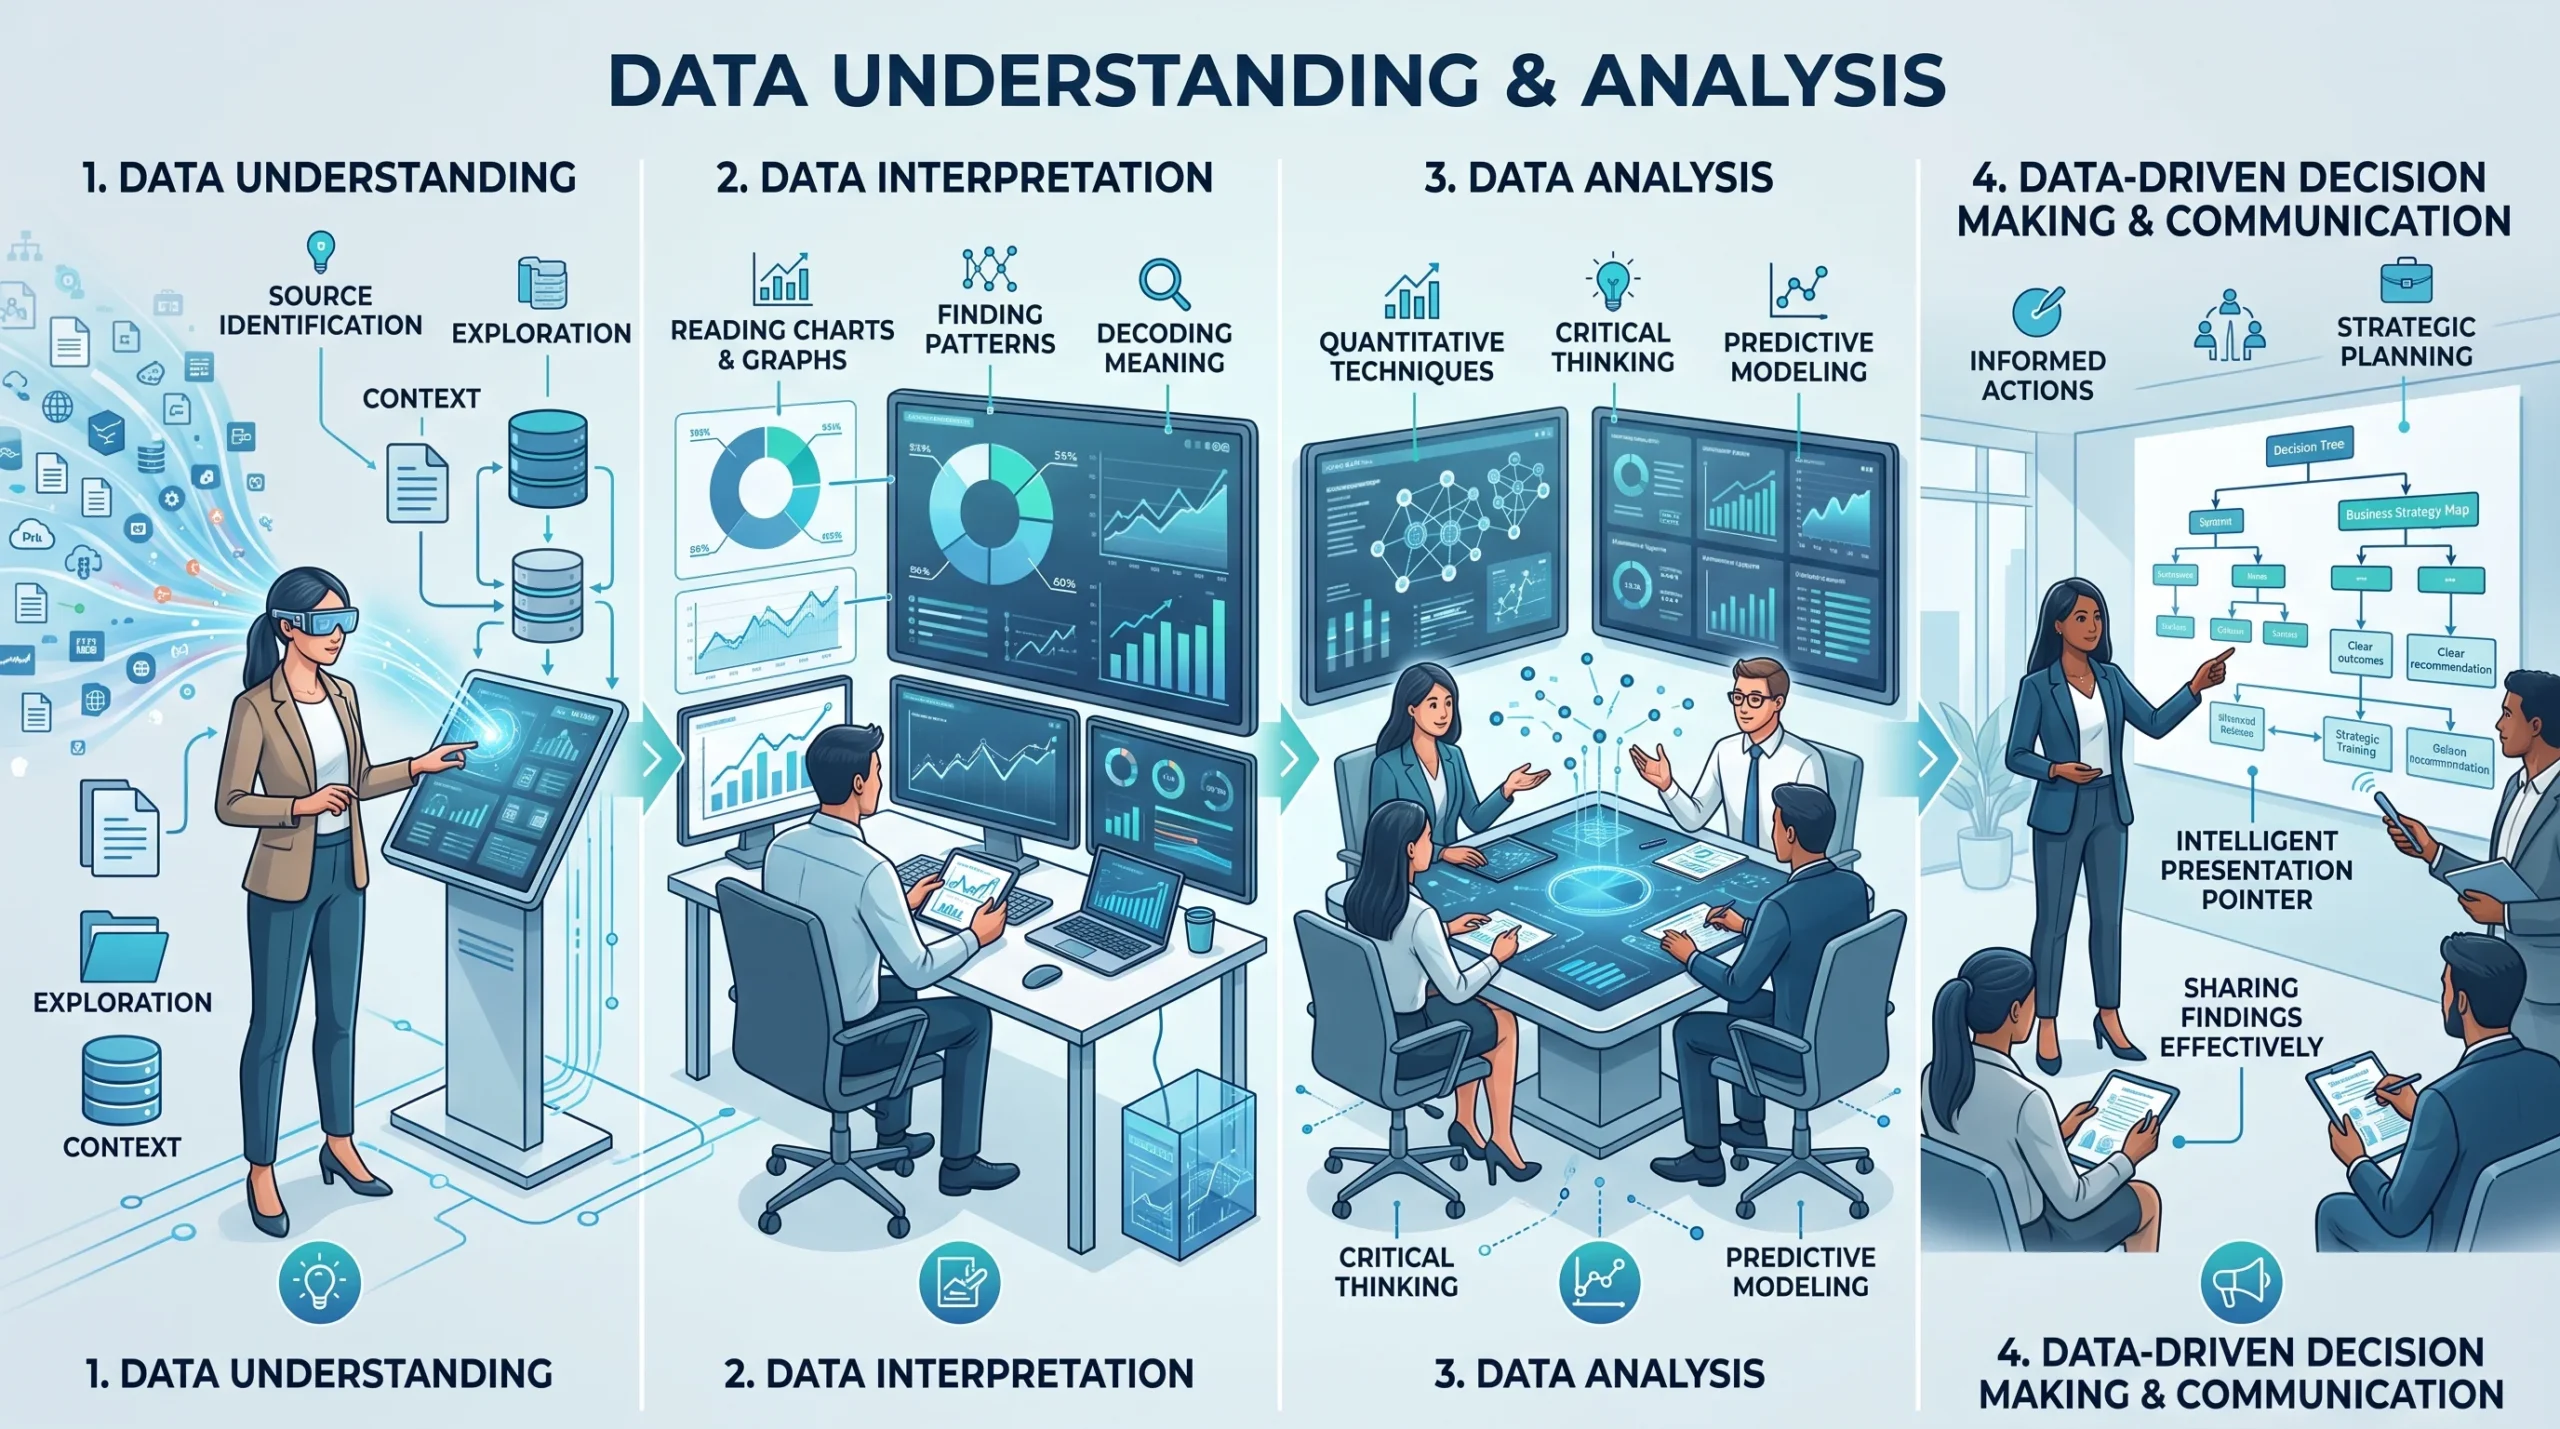
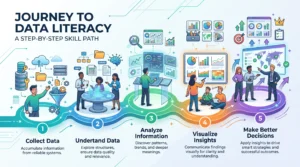
The first step to read data. Charts, tables and percentages longer seem like foreign language
Then it’s time to question it. Where did these numbers come from? What could they miss out on Third of all is its use. You use what you have learned in a real situation at home, school or in the workplace.
They’re applicable to all of us, and these are the three steps. They can be used by a teenager when checking sports statistics, a parent reading a school report, or a retiree reading numbers pertaining to health.
Why Data Literacy Matters Right Now
Information moves faster than ever. Social media posts share graphs. Ads promise big results with small numbers. News stories lean on surveys. Without data literacy, it is easy to accept every claim at face value.
People who understand data feel less pushed around. They notice when a chart starts at a strange number to make a change look bigger. They see when a survey only asked a small group of people. They protect themselves from weak arguments dressed up as facts.
Everyday Moments That Benefit
At the doctor’s office a report shows blood pressure trends. Data literacy helps you ask clear questions instead of nodding quietly.
At work a manager shows sales numbers. You can tell whether the rise is steady or just one lucky week.
At home a utility bill arrives with new graphs. You spot the months that used more energy and adjust without guessing.
How to Grow Data Literacy Without Overwhelm
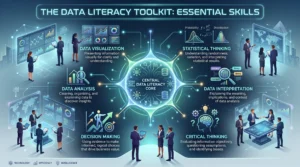
You do not need fancy software long courses. Small habits build skill over time.
Start With What You Already See
Look at the weather app. Notice how temperature is shown hour by hour. Ask yourself what the highest and lowest points mean for your plans.
Check a product review page. Count how many people left five-star ratings versus one-star. See whether the average score matches the written comments.
These tiny practices train your eye. After a few weeks the habit feels natural.
Practice With Free and Friendly Sources
Public libraries often share simple data sets about local life. News sites sometimes publish the original numbers behind a story. Government websites list census or health figures in plain tables. Spend ten minutes with one of them. Write down one thing that surprised you.
Talk about what you notice with family or friends. Different eyes catch different details. The conversation itself strengthens understanding.
Common Stumbling Blocks and How to Step Over Them
Many people freeze when they see percentages or averages. Others trust a colorful chart simply because it looks official. Both reactions are common and fixable.
One frequent trap is the average that hides the range. Data literacy trains you to ask for the spread, not just the middle number.
Another trap is sample size. A survey of twenty people can never speak for a whole city. Once you know to check how many voices are behind the claim, weak data loses its power.
A Quick Look at Skill Levels
| Level | What You Can Do | Everyday Example |
| Beginner | Read simple charts and percentages | Compare two phone plans by monthly cost |
| Growing | Question sources and missing pieces | Ask who funded a health study before trusting it |
| Confident | Use data to guide real decisions | Track home energy use and lower the bill |
Practical Steps You Can Take This Week
- Compare two news stories about the same topic and record the differences between the two in terms of the number of items.
- Show a kid or friend one of the common misconceptions, like what the average number of steps means.
- Look at the serving size labels on food items and work out the actual serving size.
- Find a public data set for your town and identify a fact that is useful.
These actions remain brief and to the point. They are not added stress, they fit in the regular life.
Teaching Data Literacy Across Different Ages
Young children begin count sort objects. Older students develop skills in reading graphs for science or social studies. Workplace examples that are relevant to their work benefit adults. Numbers without jargon are often better for the older person if the numbers are related to health or finances.
Similar concepts are applicable to all groups. Don’t use jargon abbreviations. Utilize concrete examples real life situations. Take note of some brief moments of reason.
Looking Forward With Clearer Eyes
Data will continue coming in in more and more quantities. New Tools will convert numbers into pictures and stories. The curious and careful ones will remain on their feet. Data literacy cannot eradicate uncertainty. It provides you with more resources to cope with it.
You perform these skills in various ways in your daily life—when you look at maps or compare prices. It’s only natural to expand that care to charts, surveys and reports. Whenever stop and ask good question, skill strengthened.
Final Thoughts
Data literacy is about transforming data into information. It is helpful to those in the world who are not of the world. Helps to make better decisions school, home work. Start 1 chart, 1 question 1 brief conversation.
Through time, those small steps really build up confidence. It’s not about perfection. The end result should sufficient understanding to perceive world better make decisions more reasoned manner.

FAQs
In layman’s terms, what does data literacy mean?
The understanding of numbers and charts, ability to pose insightful questions about numbers, and the ability to apply answers to everyday choices.
Is one’s ability to work with mathematics necessary to be data literate?
While some simple arithmetic is helpful, it’s curiosity and careful observation, not difficult formulas, that is the key.
Can Data Literacy contribute to Online News?
Yes. It teaches you how to evaluate sample size, the source and context, and to be alert for weak claims.
But is data literacy beneficial to kids?
Definitely. By beginning to distinguish between simple graphs and making comparisons, students develop good thinking skills that will serve them well in their future lives.
How long does it take until he/she is more confident?
People see improvement in a few weeks by asking just one additional question when they see a chart/table.